The CIPFA Infoshare+ Financial Resilience Index is a comparative analytical tool intended for use by Chief Financial Officers to support good financial management.
This briefing presents an overall picture of the sector by highlighting key trends in financial risk to local authorities identified by the CIPFA Infoshare+ Resilience Index. The CIPFA Resilience Index shows a council's position on a range of measures associated with financial risk, showing where additional scrutiny may be required.
Download the CIPFA Financial Resilience Index 2024 briefing
Key messages
The 2023/24 resilience data reflect the extent of demand-led cost pressures experienced across the sector. Upper tier councils spent 78% of their net revenue expenditure (NRE) on social care in 2023/24.
The general level of reserves declined. Debt levels appear to have stabilised. However, non-metropolitan councils on average spend a disproportionately high level of NRE on servicing debt compared to other types of authorities.
English financial context
Local authorities are operating in an extremely challenging context, fraught with unprecedented levels of demand and financial pressures. Demand-led services make up an ever-growing proportion of local authority spend. Against this backdrop, the country has seen a change in government and a promise to "fix the foundations of local government".
The autumn Budget increased funding for frontline services, providing much-needed short-term relief to authorities stretched to their limits. The government has also recently launched a consultation on local government funding reforms, which are intended to be implemented from 2026/27. Alongside these, other consultations support ambitions for long-term funding reforms and improvements to service delivery - approaches that will be vital to sustaining improvement in local authorities' financial resilience.
Data for the index
The 2024 index uses figures from the 2023/24 revenue and expenditure outturn data return (RO) and reflects figures given by local authorities to the Ministry of Housing, Communities and Local Government (MHCLG), published on 12 December 2024.
Recognising that the index uses historic data, it is a picture of the relative financial position of councils at that time and uses openly available and comparative data. CFOs and other interested parties should consider it a starting point in their consideration of financial resilience. The full picture of a council's financial resilience includes its short-term and long-term arrangements to deliver balanced budgets, considering future risks and uncertainties.
Headline risk indicators
This section examines the average position for local authorities across key resilience indicators.
Reserves
Reserves are essential to a local authority's financial resilience because borrowing is restricted to specific functions and authorities are required to balance budgets annually. Reserves function as a safeguard against unforeseen events and to address expected challenges.
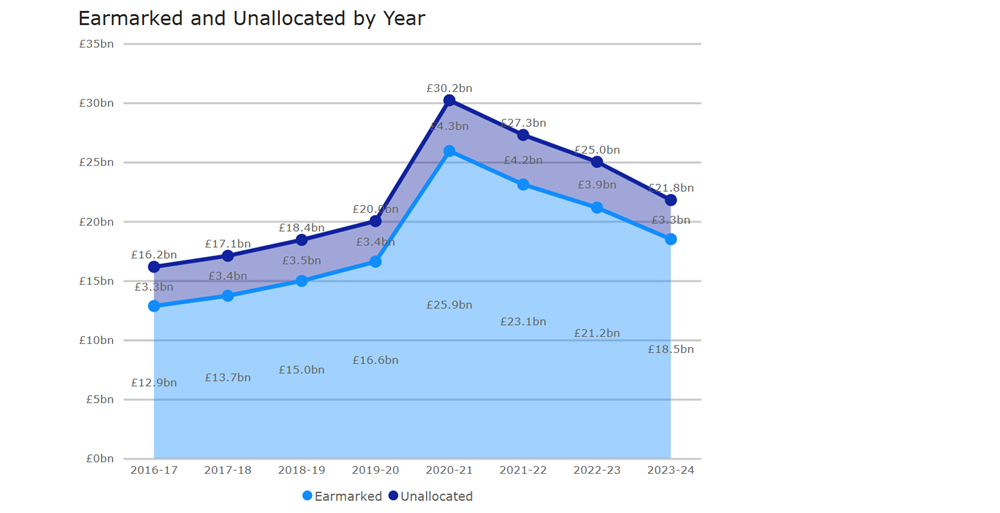
Compared to 2022/23, the data suggests an accelerated depletion of reserves held by English local authorities. While there will be several reasons for this reduction, reflecting individual circumstances, the decline in unallocated reserves (those held for unexpected financial challenges) suggests that authorities are still drawing down reserves to fund cost pressures. Additionally, decreasing earmarked reserves (those held for a specific purpose) may point to authorities expanding their capacity and implementing programmes for which reserves were created.
The Section 25 statement is a key document where CFOs must articulate the robustness of the council's estimates and reserves.
Figure 1: Total unallocated and earmarked reserves

Social care
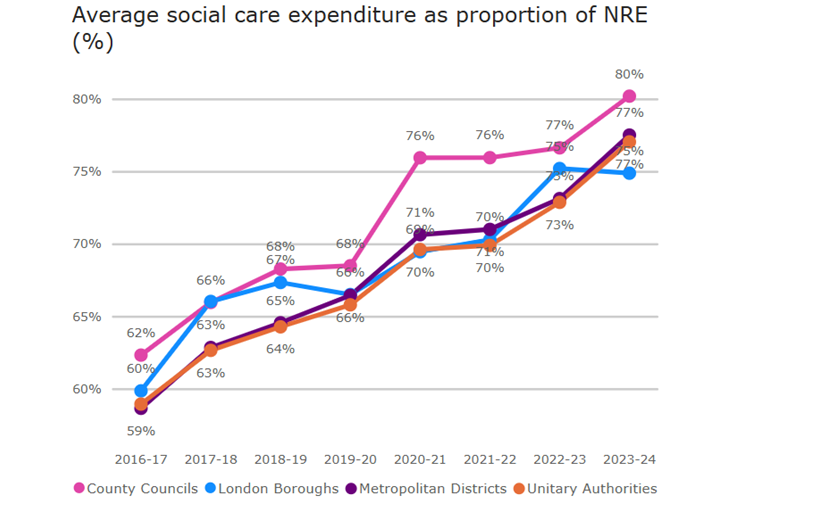
The Resilience Index shows that upper tier English authorities spend on average 78% of NRE on social care services (for both adults and children). Figure 2 shows the stark increase in the average social care expenditure as a proportion of NRE since 2016/17. This is the result of factors including the growth in demand for social care services and the cost of delivering them, which has risen steadily since 2016/17. Increased demand and cost in this statutory service reduces a council's budget flexibility, making it more difficult to respond to financial shock.
There are examples of excellent practice in social care demand management across the sector. CIPFA's report Managing rising demand in adult and children social care (2024) documents insights from local authority social care leaders making significant strides in tackling demand and the cost of social care. The report also highlights the role CFOs must play in supporting successful social care demand management.
Figure 2: Average social care expenditure as a proportion of NRE

External debt
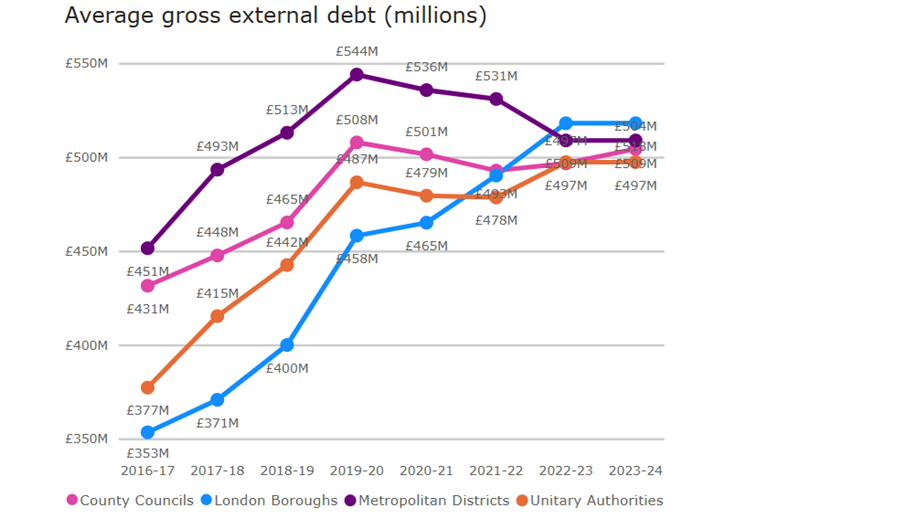
The average external debt held by English authorities has remained stable between 2022/23 and 2023/24. The debt levels for non-metropolitan district councils rose between 2016/17 and 2022/23. The reasons for additional debt will need to be examined at an individual authority level. The relative cost of debt, however the debt was accumulated, must be considered to establish exposure to financial risk.
The interest commitment for elevated levels of debt can reduce an authority's ability to respond to other financial pressures or shocks. The importance of balancing ambition with an authority's financial capacity when taking on debt cannot be overemphasised.
Figure 3: Average external debt (millions of pounds)

Growth above baseline
In anticipation of changes to the business rates retention scheme, CIPFA's Resilience Index contains an indicator on growth above baseline to highlight the risk to council funding after the reforms. The current system allows councils to retain business rates (and so income) above their baseline funding level. Many councils have accumulated growth above baseline over the decade since this system was introduced.
The government has now proposed to fully reset the baseline business rates funding. Depending on what the new baseline is, councils will experience a rise or fall in business rates income available to them when the reset happens.
CFOs need to assess growth above the baseline indicator to better understand the potential risk to the council's funding and adjust future financial plans accordingly.
Additional data
In addition to the data contained in the Resilience Index, CIPFA is aware that there are significant pressures in other service areas such as homelessness. We have therefore included below analysis on homelessness expenditure, which we are considering as a future development. Your views on expanded data sets would be welcomed.
Key message
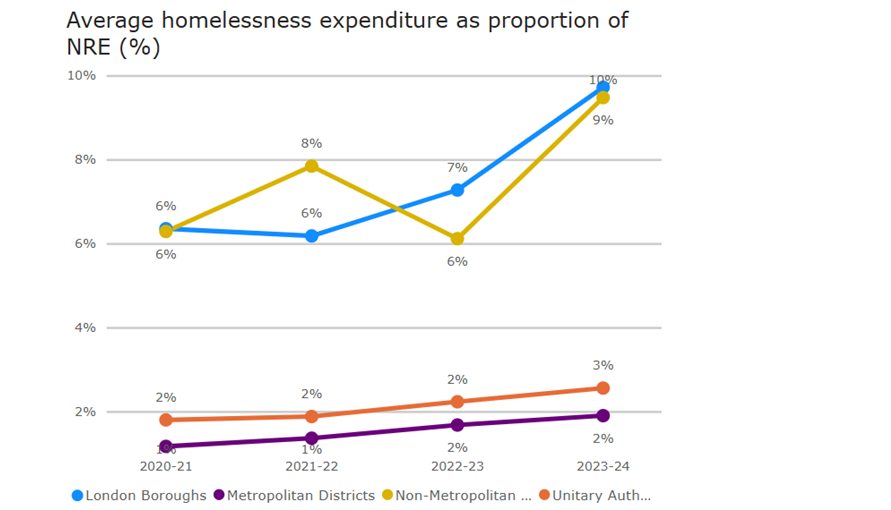
Non-metropolitan councils and London boroughs on average spent 9% and 10% of NRE respectively on addressing homelessness - a significant rise on the 2022/23 expenditure.
Homelessness
On average, London boroughs and non-metropolitan district councils spend a higher percentage of their NRE on the delivery of statutory homelessness obligations. During 2023/24, the average percentage of NRE spent on homelessness increased by 43% for London authorities and 50% for unitary authorities and non-metropolitan district councils.
Figure 4: Average homelessness expenditure as a proportion of NRE

The homelessness challenge is multifactorial, influenced by the sharp rise in the cost of living, the decline in the availability of social housing, and increasing demand for and cost of temporary accommodation. The government statistics for homelessness (2023/24) paint a similar picture.
Although the Resilience Index does not include comparative homelessness data yet, Figure 4 above shows the percentage of NRE councils spent on homelessness in the last four years. Many councils spend significantly higher than the average on addressing homelessness. CIPFA therefore recommends that CFOs proactively consider the impact of rising demand and the cost of homelessness on councils' financial resilience, planning where possible to prevent homelessness. Authorities will need to collaborate with neighbours to address social housing and homelessness issues as the impact of demand pressures extend beyond the hardest hit areas. Where applicable, authorities could also take advantage of the government's extra funding for the Affordable Homes Programme (AHP).
Conclusion
The overall financial resilience picture obtained from the Financial Resilience Index for local authorities has not improved between 2022/23 and 2023/24. However, despite the challenges, authorities continue to deliver critical services that support communities.
Looking forward, the new government has begun to address long-standing challenges in the sector. The government has also issued a consultation on key areas of local government financial reform for 2026/27. It must act swiftly and decisively to deliver significant policy and structural reform to strengthen local authorities' resilience. These five pivotal policy asks will foster a more resilient public sector.
Support from CIPFA
CIPFA has gained experience and practical knowledge through its financial resilience work with local authorities and recommends that CFOs review the range of financial resilience measures considering the council's context and make reasoned proposals to strengthen financial resilience where needed. CIPFA has a strong record of supporting councils facing financial difficulty. If you would like to talk to one of the team about how we can help you with your approach to strengthening financial resilience, please email hello@cipfa.org.
Use the Resilience Index
